Draft dashboards with AI
Describe what to watch; every drafted panel is checked and dry-run with your access before you accept it.
- In the app
- Dashboards › Ask AI
/dashboards - Needs any of
- dashboards:editai:optimize
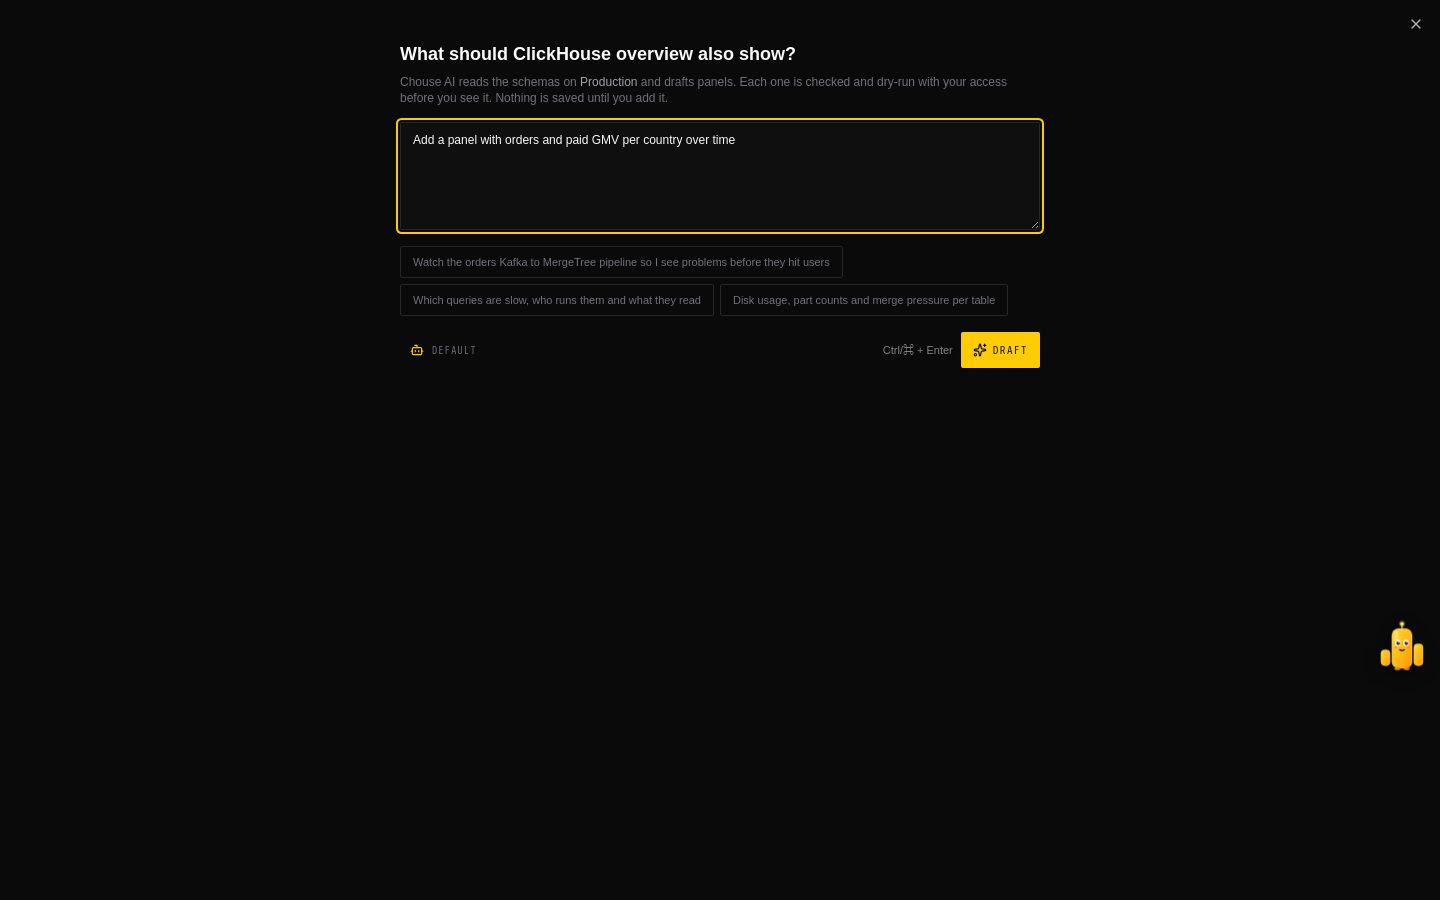
Ask AI on the Dashboards page drafts a new dashboard from a goal. On a dashboard you can edit, it drafts new panels for that dashboard. The model button under the question picks the AI model, the same pick as on the Data page. Describe what you want to watch, for example "the orders Kafka to MergeTree pipeline, so I see problems before they hit users".
The Dashboard Drafter agent reads the schemas it needs on your active connection and drafts a title, variables, and a few panels, each with its SQL, chart settings and a one-line reason. For each panel it also says what the panel is for, and that decides the chart and the layout:
| Role | The question it answers | Charts it may use |
|---|---|---|
| Current value | What is it now? | stat |
| Trend | How is it changing? | line, area, bar |
| Breakdown | What contributes? | bar, pie, donut, treemap, funnel, radar |
| Ranking | What are the top N? | horizontal bar, bar, table |
| Distribution | How is it spread? | histogram, heatmap, scatter |
| Detail | Show me the rows | table |
The model does not size panels. It marks each one primary or secondary and names its section, and CHouse places them the same way Tidy up does: a heading per section, current values in a row at the top, primary trends at full width, other charts two to a row, tables at the bottom.
Every panel is checked before you see it
Each drafted panel goes through the same checks as a save and a run, with your access:
- Its chart settings are valid, and its chart type fits its role.
- Its SQL is one read-only
SELECTthat compiles with the drafted variables. - Your data access rules allow every table it reads.
- A dry run of the query, with the dashboard limits, succeeds and returns every column the chart uses.
- The checks for charts that look right but are wrong, including whether the chart suits the result: too many slices for a pie, a time chart whose x is not a time, too many series or categories.
Each panel comes back with one of three statuses:
- Checked: it passed all five checks.
- Check this: one of the chart checks flagged something. Apply fix makes a mechanical fix when there is one, such as switching a crowded pie to a horizontal bar.
- Blocked: it failed one of checks 1–4, with the reason. A blocked panel cannot be kept.
A drafted variable that is not valid is left out, and the review says so. When adding to a dashboard, panels are checked with the dashboard's own definition of any variable name it already has, and a new variable that would take the dashboard past 10 is left out.
Review the draft
The draft opens full screen, laid out the way it will be saved:
- Panels, grouped by section. Tick or untick a panel, or a whole section with its heading's box. Select picks all, none, or only the checked panels. A blocked panel shows its reason under its name and cannot be ticked.
- Preview: the ticked panels placed by the layout engine, each running its query with the dashboard's time range (6 hours for a new dashboard) and each variable's default. Panels run as you scroll to them, a few at a time. When adding to a dashboard, the new panels are shown on their own, below a note of how many panels are already there.
- Details: select a panel in the list or in the preview to see why it was drafted, what to check with an Apply fix for each mechanical fix, and its SQL.
The counts in the header (checked, check this, blocked) filter the list. Apply N fixes applies every mechanical fix at once. Rename a new dashboard in the header before you create it.
On a tablet the panels and the preview are two tabs, and a panel's details slide in from the side. On a phone they slide up from the bottom, and Create sits in a bar at the bottom of the screen.
The preview needs query:execute. Without it you can still review and add the panels.
Refine and regenerate
Refine… sends what you want changed — "drop the merge panels and add disk usage per shard" — together with the draft as you have it: fixes you applied, and panels you unticked, which stay out unless you ask for them back. The AI revises the draft instead of starting over, and every panel is checked again. A title you typed is kept.
Regenerate in a panel's details drafts just that panel again, optionally with a note on what to change. The rest of the draft stays as it is.
Undo brings back the draft from before the last refine or regenerate, up to five steps. Cancel stops waiting for an answer; the draft is unchanged. If a request fails, the draft stays as it was and the error is shown.
Nothing is saved until you add it
Press Create dashboard (or Add N panels, on an existing dashboard). If a ticked panel still has something to check, CHouse asks first and can show you those panels instead. The draft is then saved through the normal dashboard save, which checks it again. When adding to a dashboard, a variable the dashboard already has keeps its own definition, the new panels are placed below the existing ones, and the dashboard scrolls to them and outlines them for a moment.
The button is disabled, with the reason shown next to it, when no panel is ticked, a new dashboard has no title, or the panels would not fit: a dashboard holds at most 60 panels (section headings included), 40 of them charts, and 10 variables.
A draft is tied to the connection it was checked on. If you switch connection in the dock, the preview stops and you cannot refine or add the panels until you switch back. On a dashboard that is not assigned to your active connection, switch to one of its connections before drafting.
Closing the window with a draft open asks first, and so does Start over once you changed the draft. Start over keeps your question.
Drafting needs dashboards:edit and ai:optimize. Its tokens, cost and the schema details sent to the model provider appear in AI activity. Change the agent's model or prompt in AI Governance › Assistant.